
Vale Stock’s Price Weakness Presents Compelling Opportunity
Contrarian income investors who are looking for a high-yield stock with above-average price-appreciation potential should take a look at Vale SA (NYSE:VALE). The company is a $49.1-billion market-cap metals producer that has paid dividends for 24 consecutive years.
Vale, which has been around since June 1942, has grown into a major player in the exploration and mining of iron, nickel, copper, and cobalt. The company has a global footprint, with operations in more than 20 countries. (Sources: “Who We Are” and “Mining,” Vale SA, last accessed June 11, 2024.)
What’s encouraging is that the metals that Vale produces are increasingly being employed in the manufacturing of electric vehicles. The metals are specifically used in the high-tech advanced engines that power those vehicles.
Vale stock traded at a new 52-week low of $11.23 on June 10 and has gone down by 28.1% so far in 2024 (as of this writing). In June 2021, the stock was trading more than 100% higher, at $23.18. (Source: “Vale S.A. (VALE),” Yahoo! Finance, last accessed June 11, 2024.)
The major price deterioration presents a compelling risk/reward opportunity to investors.

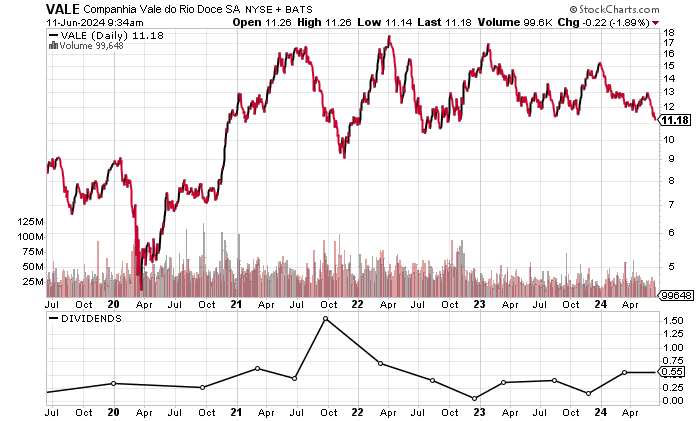
Chart courtesy of StockCharts.
Free Cash Flow Machine Buying Back Shares
Vale SA isn’t the kind of company that delivers outsized growth, but what the company does do is generate colossal revenues while generating consistent profitability and free cash flow (FCF). This is ideal for income investors.
The last four years saw the company’s revenues reach a period high of $54.5 billion in 2021, but that was followed by two consecutive years of contraction. Nonetheless, Vale produces hefty revenues.
Analysts estimate that Vale SA will have a small revenue reduction to $40.69 billion in 2024, prior to a slight rebound to $41.27 billion in 2025. (Source: Yahoo! Finance, op. cit.)
| Fiscal Year | Revenues (Billions) | Growth |
| 2020 | $39.55 | N/A |
| 2021 | $54.5 | 37.8% |
| 2022 | $43.84 | -19.6% |
| 2023 | $41.78 | -4.7% |
(Source: Yahoo! Finance, op. cit.)
Vale SA’s gross margin picture has been mixed, reaching a four-year best in 2021 before declining for two straight years.
| Fiscal Year | Gross Margins |
| 2020 | 55.9% |
| 2021 | 60.0% |
| 2022 | 45.2% |
| 2023 | 42.3% |
It’s clear that Vale SA’s gross margin contraction resulted in lower generally accepted accounting principles (GAAP)-diluted earnings-per-share (EPS) in 2022 and 2023.
On the plus side, analysts expect Vale to grow its earnings to $2.26 per diluted share in 2024, followed by $2.22 per diluted share in 2025. (Source: Yahoo! Finance, op. cit.)
| Fiscal Year | GAAP-Diluted EPS | Growth |
| 2020 | $0.95 | N/A |
| 2021 | $4.47 | 370.5% |
| 2022 | $4.05 | -9.4% |
| 2023 | $1.83 | -54.8% |
(Source: Yahoo! Finance, op. cit.)
Vale SA’s funds statement shows consistent positive FCF, albeit the last two years witnessed a decline.
Part of the reason for the drop in FCF was Vale aggressively buying back its own shares and reducing its debt. Vale bought back $5.55 billion worth of its own shares in 2021, $6.04 billion worth in 2022, and $2.71 billion in 2023.
| Fiscal Year | FCF (Billions) | Growth |
| 2020 | $10.1 | N/A |
| 2021 | $20.65 | 104.5% |
| 2022 | $6.04 | -70.8% |
| 2023 | $7.25 | 20.0% |
(Source: Yahoo! Finance, op. cit.)
At the end of March, Vale SA’s balance sheet held $17.3 billion in total debt and $3.79 billion in cash.
An encouraging sign is that the company has been actively paying down its debt, as shown in the following table.
| Fiscal Year | Debt Repayment (Billions) |
| 2020 | $6.27 |
| 2021 | $2.14 |
| 2022 | $2.52 |
| 2023 | $0.89 |
(Source: Yahoo! Finance, op. cit.)
Another way to look at Vale SA’s debt situation is by comparing its earnings before interest and taxes (EBIT) to its interest expenses. The following table shows that the company’s EBIT easily covered its interest expenses in the last four consecutive years. Vale’s interest coverage ratio in 2023 was strong, at 9.3 times.
This suggests the company has no problem paying for its debt obligations.
| Fiscal Year | EBIT (Billions) | Interest Expense (Billions) |
| 2020 | $9.35 | $2.36 |
| 2021 | $31.09 | $1.55 |
| 2022 | $20.73 | $0.95 |
| 2023 | $12.49 | $1.34 |
(Source: Yahoo! Finance, op. cit.)
Vale SA’s Piotroski score—an indicator of a company’s balance sheet, profitability, and operational efficiency—is a reasonable reading of 5.0, which is just above the midpoint of the Piotroski score’s range of 1.0 to 9.0.
Investors Can Expect Vale Stock’s Dividends to Continue
Vale SA’s forward dividend yield of 15.38% is very high, which is largely due to share-price deterioration.
Given the company’s profitability and FCF generation, I expect it to continue paying dividends. Vale’s dividend coverage ratio is reasonable at 2.2 times (as of this writing).
There’s a possibility that management will increase Vale stock’s dividend over the next two years, but given the company’s current payout ratio of 77.69%, the probability is likely low at this time.
| Metric | Value |
| Dividend Streak | 24 Years |
| 7-Year Dividend Compound Annual Growth Rate | 68.3% |
| 10-Year Average Dividend Yield | 7.7% |
| Dividend Coverage Ratio | 2.2 |
The Lowdown on Vale SA
Income investors who are willing to be patient could receive above-average share-price appreciation from Vale stock while collecting its high-yield dividends.
In addition to paying dividends, Vale SA has increased shareholder value by aggressively repurchasing shares of its own stock.