Middle East Tensions Could Lift KRP Stock
Oil prices jumped on October 1 on rising tensions in the Middle East region that are showing signs of escalating. Of course, we all hope this will not play out, but if it does, expect oil prices to spike. West Texas Intermediate (WTI) oil jumped over four percent to the $70.00-handle on the news.
The tensions are attracting buying to the energy group, specifically the upstream segment, which is most tied to oil prices.
To play a potential jump in oil prices here, consider small-cap Kimbell Royalty Partners LP (NYSE:KRP).
Founded in 1998, the company’s portfolio of assets comprises around 17 million gross acres spread across 28 states. Kimbell Royalty Partners owns in excess of 129,000 gross wells, including over 50,000 wells located in the energy-rich Permian Basin. (Source: “About,” Kimbell Royalty Partners LP, last accessed October 1, 2024.)
A look at the chart shows Kimbell Royalty stock just below its 52-week high of $17.11 and 34.5% below its 10-year high of $24.50 in July 2018. In 2024, KRP stock is up 6.6%.
In an encouraging technical sign, the Kimbell Royalty stock price of $16.05 is above both the stock’s 50-day moving average (MA) of $15.90 and 200-day MA of $15.83 as of October 1.
Moreover, the chart shows a golden cross, which is a bullish technical crossover that occurs when the 50-day MA is above the 200-day MA. If this holds, we could see a rally in Kimbell Royalty stock to above $20.00.

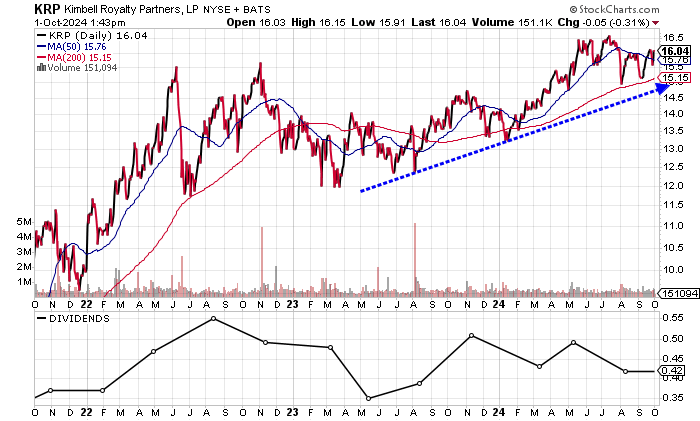
Chart courtesy of StockCharts.com
Revenue Growth Could Jump
Kimbell Royalty’s revenues were negatively impacted by the pandemic in 2020, but this was followed by two years of high double-digit growth to the record $285.0 million in 2022.
The company reported slightly lower revenues in 2023 due partly to the drop in oil prices.
| Fiscal Year | Revenues (Millions) | Growth |
| 2019 | $110.0 | 64.3% |
| 2020 | $92.9 | -15.5% |
| 2021 | $178.4 | 92.0% |
| 2022 | $285.0 | 59.8% |
| 2023 | $273.2 | -4.2% |
(Source: “Kimbell Royalty Partners L.P.,” MarketWatch, last accessed October 1, 2024.)
Analysts expect Kimbell Royalty Partners to drive revenues 18.8% higher to $324.5 million in 2024, followed by $347.2 million in 2025. (Source: “Kimbell Royalty Partners, LP (KRP),” Yahoo! Finance, last accessed October 1, 2024.)
The company produces strong gross margins, with them hovering above 90% in the last five years.
| Fiscal Year | Gross Margins |
| 2019 | 93.0% |
| 2020 | 93.1% |
| 2021 | 94.1% |
| 2022 | 94.3% |
| 2023 | 92.6% |
Kimbell Royalty Partners has delivered generally accepted accounting principles (GAAP) profits since 2021, including a record $1.72 per diluted share in 2022.
| Fiscal Year | GAAP-Diluted Earnings Per Share | Growth |
| 2019 | -$3.92 | -27.3% |
| 2020 | -$4.85 | -23.7% |
| 2021 | $0.51 | 110.5% |
| 2022 | $1.72 | 237.4% |
| 2023 | $0.91 | -47.2% |
(Source: MarketWatch, op. cit.)
On an adjusted basis, the company reported $1.18 per diluted share in 2023. Analysts expect this to drop to $0.51 per diluted share in 2024, before rebounding to $0.71 per diluted share in 2025. (Source: Yahoo! Finance, op. cit.)
Kimbell Royalty Partners has generated positive free cash flow (FCF), with it hitting a record $170.1 million in 2022 before sinking to negative FCF in 2023. The negative FCF in 2023 was due to lower profitability, a big jump in capital expenditures, and a rise in share buybacks. I expect FCF to return to positive in 2024, which was reflected by the $131.8 million in FCF in the first half of 2024. (Source: Yahoo! Finance, op. cit.)
| Fiscal Year | FCF (Millions) | Growth |
| 2019 | $79.8 | N/A |
| 2020 | $61.3 | -23.2% |
| 2021 | $91.2 | 48.9% |
| 2022 | $170.1 | 86.6% |
| 2023 | -$316.5 | -286.1% |
(Source: MarketWatch, op. cit.)
Kimbell Royalty’s balance sheet is relatively sound, with strong working capital, cash of $31.0 million, and total debt of $267.8 million. The debt-to-equity ratio of around 27.9% is manageable and poses no issues. Plus, the company is profitable and generally delivers positive FCF. (Source: Yahoo! Finance, op. cit.)
Kimbell Royalty has also easily covered its interest expense with higher earnings before interest and taxes (EBIT), except in 2020.
| Fiscal Year | EBIT (Millions) | Interest Expense (Millions) | Interest Coverage Ratio |
| 2020 | -$250.5 | $6.4 | N/A |
| 2021 | $51.7 | $9.2 | 5.62X |
| 2022 | $117.4 | $13.8 | 8.51X |
| 2023 | $112.7 | $29.5 | 3.82X |
(Source: Yahoo! Finance, op. cit.)
The Piotroski score, an indicator of a company’s balance sheet, profitability, and operational efficiency, shows a reasonable reading of 5.0, which is just above the midpoint of the 1.0 to 9.0 range.
Kimbell Royalty Stock: Dividends Reduced But Should Continue
Kimbell Royalty stock has paid dividends in eight consecutive years, but the company reduced its quarterly dividend to $0.42 per share in August, versus $0.49 per share in May. Prior to this, the quarterly dividend was $0.43 per share in March and $0.51 per share in November 2023. (Source: Yahoo! Finance, op. cit.)
| Metric | Value |
| Dividend Streak | 8 Years |
| Dividend 3-Year CAGR | 39.0% |
| 3-Year Average Dividend Yield | 13.4% |
| Dividend Coverage Ratio | 1.6X |
The Lowdown on Kimbell Royalty Stock
While the dividend cut in August was disappointing, Kimbell Royalty Partners needs to carefully monitor its funds so it can expand production. Based on the company’s recent dividend history, the quarterly dividend has been inconsistent largely based on its situation.
KRP stock could deliver share price appreciation, especially if oil prices and demand rise. In the meantime, you receive a nice forward dividend yield of 10.47% with Kimbell Royalty stock while waiting.