
Cash-Rich Ternium Stock Yielding 8.94%


Steel Maker Generates Tons of Free Cash Flow
In my view, the ideal dividend stocks are sound companies that provide income investors with a nice dividend yield and the opportunity for average price appreciation.
That’s the case with Luxembourg-based Ternium SA (NYSE:TX). Ternium stock is down 13.9% this year, as of June 25, but offers a compelling risk/reward income opportunity for patient investors.
Ternium is a mid-cap producer of steel products used by the manufacturing and construction segments.
The company is focused on the Latin American market. In the first quarter of 2024, Ternium SA’s top two markets were Mexico, representing 53.4% of steel shipments, and Brazil, at 23.7%. These markets are trailed by the U.S., at eight percent. (Source: “The Company,” Ternium SA, last accessed June 25, 2024.)
As of writing, TX stock sits just north of its 52-week low of $35.22, 19.3% off its range high of $45.58.
Technically, Ternium stock looks oversold, trading just below its 200-day moving average (MA) of $39.93 and 50-day MA of $41.41.
But we could see a rally in TX stock given that there’s a golden cross in place on the chart. This is a bullish technical crossover when the 50-MA is above the 200-day MA.
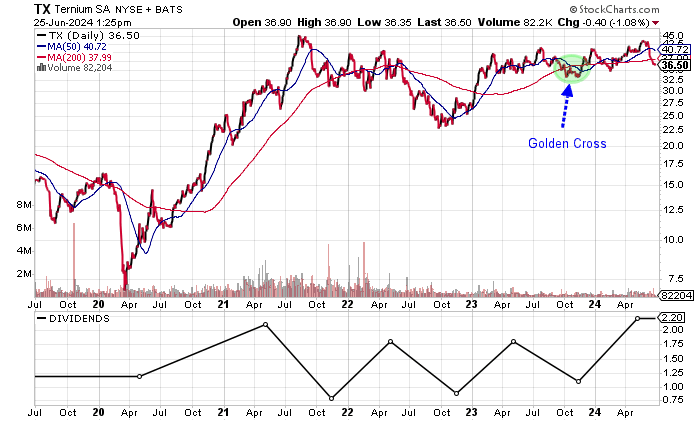
Chart courtesy of StockCharts
Over $2 Billion in Net Cash
Ternium SA changed its reporting currency from the Argentine peso to the U.S. dollar in January 2020.
The four-year revenue picture shows growth in the last three consecutive years, highlighted by the record $17.6 billion in 2023. The company’s revenue doubled from 2020 to 2023, representing an impressive compound annual growth rate (CAGR) of 26.3%.
| Fiscal Year | Revenues (Billions) | Growth |
| 2020 | $8.7 | -14.3% |
| 2021 | $16.1 | 84.2% |
| 2022 | $16.4 | 2.0% |
| 2023 | $17.6 | 7.3% |
(Source: “Ternium S.A. (TX), ” Yahoo! Finance, last accessed June 25, 2024.)
The growth is expected to continue. Analysts estimate that Ternium will ramp up revenues by 8.3% to $19.1 billion in 2024, then hitting $19.4 billion in 2025. There’s a high estimate of $21.2 billion for 2025. Ternium stock trades at an attractive 0.37 times its consensus 2025 revenue estimate. (Source: Yahoo! Finance, op. cit.)
The company’s gross margins declined during the pandemic year of 2020 before expanding significantly in 2021. After contracting in 2022, Ternium SA came back with strong margin growth in 2023.
| Fiscal Year | Gross Margins |
| 2020 | 18.7% |
| 2021 | 38.5% |
| 2022 | 23.9% |
| 2023 | 29.8% |
A concern when it comes to Ternium has been its inconsistent reporting of generally accepted accounting principles (GAAP) profitability. Following the high point in 2021, GAAP profits have declined in two straight years, but the outlook is encouraging.
| Fiscal Year | GAAP-Diluted EPS | Growth |
| 2020 | $4.00 | N/A |
| 2021 | $19.50 | 387.5% |
| 2022 | $9.00 | -53.8% |
| 2023 | $3.40 | -62.2% |
(Source: Yahoo! Finance, op. cit.)
Analysts expect Ternium to report a more than doubling of profits to $7.50 per diluted share in 2024, followed by $7.66 per diluted share in 2025. There are high estimates of $9.95 and $11.25, respectively, for 2024 and 2025. (Source: Yahoo! Finance, op. cit.)
The estimates give TX stock an attractive forward price-earnings multiple of 4.8 times the consensus 2025 earnings-per-share estimate.
Ternium SA has generated strong free cash flow (FCF), which supports dividends. The decline in 2024 was due to the lower profits and higher capital expenditures.
| Fiscal Year | FCF (Billions) | Growth |
| 2020 | $1.20 | N/A |
| 2021 | $2.15 | 79.3% |
| 2022 | $2.17 | 0.9% |
| 2023 | $1.04 | -52.1% |
(Source: Yahoo! Finance, op. cit.)
The company’s balance sheet points to a whopping $4.1 billion in cash and $2.3 billion in total debt. Its working capital is also strong. (Source: Yahoo! Finance, op. cit.)
The healthy fundamentals and cash resulted in an extremely strong interest coverage ratio of 27.3 times in 2023.
The following table shows that Ternium has easily covered its interest payments via much higher earnings before interest and taxes (EBIT).
| Fiscal Year | EBIT (Billions) | Interest Expense (Millions) |
| 2020 | $1.21 | $46.6 |
| 2021 | $5.8 | $27.0 |
| 2022 | $2.71 | $46.7 |
| 2023 | $1.45 | $125.4 |
(Source: Yahoo! Finance, op. cit.)
Now look at the Piotroski score, an indicator of a company’s balance sheet, profitability, and operational efficiency. It shows a reasonable reading of 4.0, which is just below the midpoint of the 1.0 to 9.0 range. I don’t see any financial issues at this point.
Strong Profitability & FCF to Drive Dividends
The forward dividend yield of 8.94% is attractive. TX stock has generated a seven-year dividend CAGR of 13.6%. (Source: Yahoo! Finance, op. cit.)
I don’t foresee issues with the dividends given the company’s strong dividend coverage ratio of 4.1 times. The expected increase in profits and likely FCF should allow Ternium SA to raise dividends.
| Metric | Value |
| Dividend Growth Streak | 1 year |
| Dividend Streak | 4 years |
| Dividend 7-Year CAGR | 13.6% |
| 10-Year Average Dividend Yield | 4.8% |
| Dividend Coverage Ratio | 4.1X |
The Lowdown on Ternium Stock
Ternium stock could end up being a fantastic opportunity for income investors seeking dividends and capital appreciation.
The fact that there’s over $4.0 billion in cash coupled with the strong fundamentals makes Ternium SA a compelling opportunity.